
The past decade has been a pretty good time to be an investor in global equity markets. Only one year in the past 10 years has seen a negative return (2018) and over this period £100 invested in global equities would have turned into approximately £330.
Since 1999, we have seen two prolonged, material market falls being the Tech Wreck of 2000-2003 (-48%), when the dot.com stocks crashed, and the Global Financial Crisis in 2007-2009 (-34%). Yet, even from the tops of the market in 2000 and 2007, global markets have still turned £100 in circa £390 and £370 respectively. Taking a long-term view on equity investments makes good sense but can be hard to do in the noise of day-to-day market movements. As we write, for example, Facebook fell 20% overnight!
As an investor, your equity allocation (growth assets) is the long-term driver of portfolio returns and needs to be viewed with your true investment horizon in mind. Most of us should be planning to receive a card from the Queen at some point in the future!
You do not need this capital now, so you should try to avoid being concerned with shorter-term market movements. You can make up all sorts of stories and ‘what if’ scenarios about where the market might be headed. You may be right, but you may be wrong. Generally, this is an unhelpful process and is best avoided. Remember that market prices reflect all investors views, many of which will be similar to your own.
It is not nice when our portfolios fall in value – as they have done so far in 2022 – but the reality is it does not really matter, as our horizons are long (if they weren’t you would not be invested in equities) and it is this very uncertainty of outcomes from investing in a very broad array of companies that delivers the higher returns that equities eventually bring.
Every year, markets fall from some market high, but despite these falls, markets can produce returns. Long-term investors who get shaken out of markets pay dearly in the long run.
We have charted the MSCI All Countries World Index, which represents the performance of the full opportunity set of large- and mid-cap stocks across 23 developed and 25 emerging markets, to provide a global view of markets. We have charted the annual performance in the blue bar and the maximum loss from buying at the highest price and selling at the lowest price over the period.
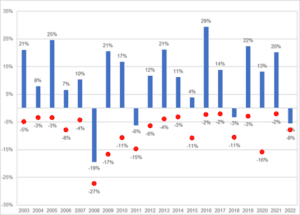
Data: MSCI ACWI Index GR in GBP from FE Analytics
Despite the large falls from highest price to lowest price each year (red dots), look how often market returns are positive. This year markets may go up, down or remain stationary, nobody knows. Bears will say ‘down’, bulls will say ‘up’, and most people will be entirely uncertain! The markets have started down in 2022, but that tells us little about the future. Markets do what markets do.
Investment Risk Warnings
Please remember the value of your investments and any income from them can go down as well as up and you may get back less than the amount you originally invested. All investments carry an element of risk which may differ significantly.
If you are unsure as to the suitability of any particular investment or product, you should seek professional financial advice. Tax rules may change in the future and taxation will depend on your personal circumstances. Charges may be subject to change in the future.
For each of the portfolios we recommend we are able to demonstrate, using back tested simulated data, the historic returns, the anticipated future returns (allowing for inflation) and the historic downsides (including the worst-case scenario that would have been experienced had you been invested throughout the data period), over a variety of time periods.